Both images showed us sales configurations.
H1:
-the price was rejected by W / R1, but it is above the W1 pivot;
- MACD, the price is below the signal line and made the last 2 peaks below this line;
-RSI had gone below 50;
- no divergence formed, RSI faithfully followed the price path;
-H1 above SMA 200;
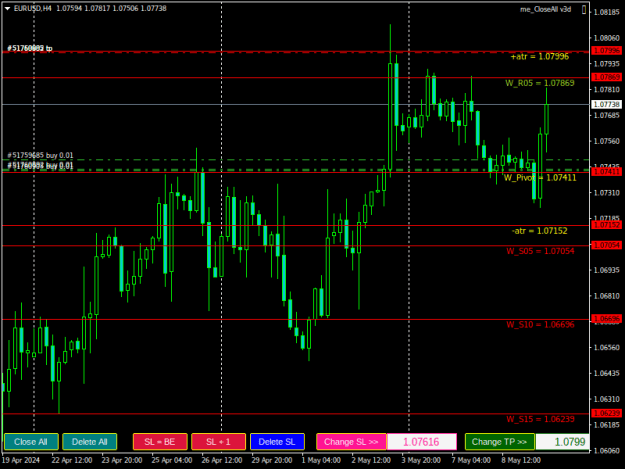
H4:
-the price has been rejected 2 times by W / R1, but it is above the W1 pivot;
-RSI over 50;
- no divergence formed, RSI faithfully followed the price path;
-H4 above SMA 200;
- MACD, the price moved away from the signal line.
But fundamentally I was of a different opinion.
H1:
-the price was rejected by W / R1, but it is above the W1 pivot;
- MACD, the price is below the signal line and made the last 2 peaks below this line;
-RSI had gone below 50;
- no divergence formed, RSI faithfully followed the price path;
-H1 above SMA 200;
H4:
-the price has been rejected 2 times by W / R1, but it is above the W1 pivot;
-RSI over 50;
- no divergence formed, RSI faithfully followed the price path;
-H4 above SMA 200;
- MACD, the price moved away from the signal line.
But fundamentally I was of a different opinion.
My posts are not trading advice.