Hi all,
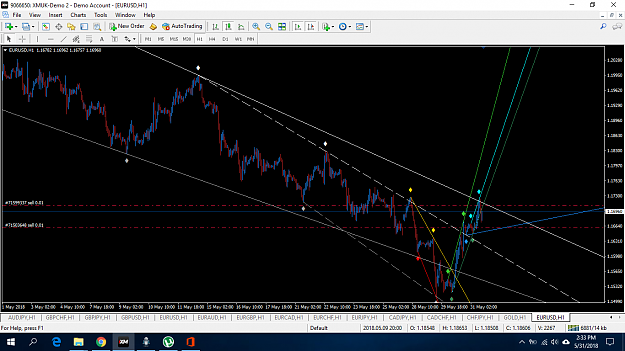
A few months ago i paid someone to code this for me. I thought it might help. I didn't use it much, it gives an idea about where the price is going, but because is ZZ things can get blurry and deceitful, there too much noise on the chart with all those lines.
Anyway i thought i might contribuite a bit on this forum and put these indicator here, maybe it will help someone or give him a new idea.
Although there are multiple files, is just one indicator made for different timeframes and with different ZZ values.
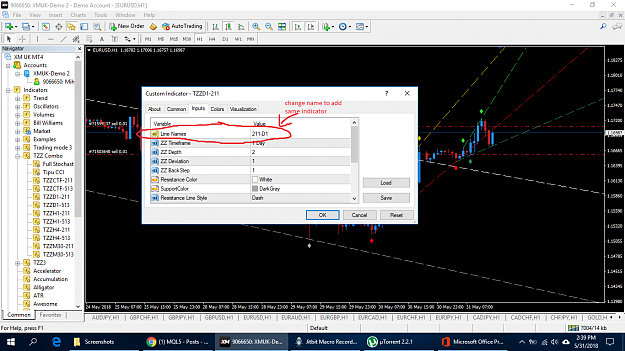
Long story short there are files from M30 to D1 for ZZ values 2-1-1 and 5-1-3. The original file didn't had all those options (MTF candle alert, i couldn't add more then 1 indicator to the chart). I'm not very good at coding, but i managed to modify it so it would be more versatile.
You can change those values for any timeframe you want and can get alert from any TF candle. For example, u can add Week ZZ and get alert from the first H1 candle that breaches that line, or get alert from the first H4 candle that breaches that line while being on H1 chart. Use any combination u like.
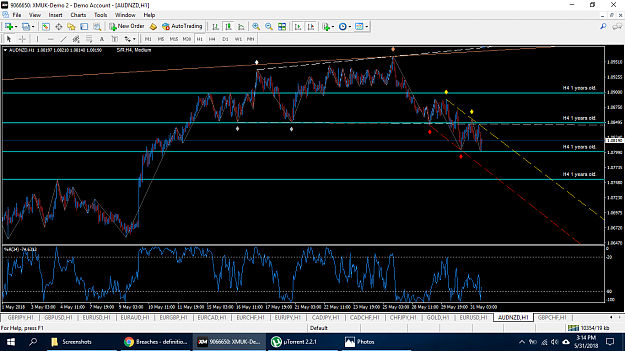
Beware, this is ZigZag. Just because price breaches line, dosen't mean trend is changing. I saw cases when price broke red line (H4 support) and continued to go up along side the support line, while being outside of it, until a new H4 ZZ Support was created.
A few months ago i paid someone to code this for me. I thought it might help. I didn't use it much, it gives an idea about where the price is going, but because is ZZ things can get blurry and deceitful, there too much noise on the chart with all those lines.
Anyway i thought i might contribuite a bit on this forum and put these indicator here, maybe it will help someone or give him a new idea.
Although there are multiple files, is just one indicator made for different timeframes and with different ZZ values.
Long story short there are files from M30 to D1 for ZZ values 2-1-1 and 5-1-3. The original file didn't had all those options (MTF candle alert, i couldn't add more then 1 indicator to the chart). I'm not very good at coding, but i managed to modify it so it would be more versatile.
You can change those values for any timeframe you want and can get alert from any TF candle. For example, u can add Week ZZ and get alert from the first H1 candle that breaches that line, or get alert from the first H4 candle that breaches that line while being on H1 chart. Use any combination u like.
Beware, this is ZigZag. Just because price breaches line, dosen't mean trend is changing. I saw cases when price broke red line (H4 support) and continued to go up along side the support line, while being outside of it, until a new H4 ZZ Support was created.
Attached Image(s) (click to enlarge)


Attached File(s)